'Tis the season for visually striking and elaborately informative overviews. Just about every social platform has some kind of year-in-review feature to highlight our comings and goings and, I have to say, I am a sucker for a quality infographic.
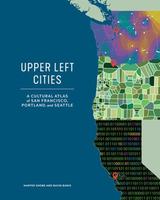
 When I first saw Upper Left Cities by Hunter Shobe and David Banis (Sasquatch, $30), I was mesmerized. It's a gorgeous compendium of cultural data related to Seattle, Portland and San Francisco laid out with eye-popping aesthetics concerning regional ephemera. For instance, there is a delightful little graph that looks at the variety of businesses that share the Sasquatch name with the elusive cryptid, with breweries and eateries dominating the chart. The book cleverly covers urban landscapes, nature, social relations, commerce and popular culture in styles both eclectic and apropos. How about a timeline of early 20th-century jazz clubs delineated on a musical staff?
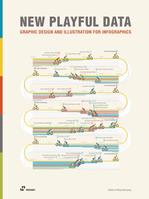
 Another exceptional example of infographic allure is New Playful Data, edited by Wang Shaoqiang (Hokai, $45). It features rigorous science as well as inventive graphic design from numerous contributors. I was particularly intrigued by the entry about standing desks, having switched to one years ago. I don't know if I feel exactly 62% happier, as the report indicates, but it certainly improved my workflow.
 The World Explained in 264 Infographics by Jan Schwochow (Prestel, $65) condenses tons of global data in realms both scientific and social into brilliant and digestible overviews. Also, Queerstory: An Infographic History of the Fight for LGBTQ+ Rights, illustrated by Rebecca Strickson (Tiller, $16.99) celebrates some of the most monumental advances toward equality. There's something for every curious mind, so books like these make great last-minute gift items or pleasant diversions for those long dark winter nights. --Dave Wheeler, associate editor, Shelf Awareness

